PROPERTY CRIME BY MONTH
There were nearly 8 million property crimes in 2009, including figures for burglary, larceny theft, and motor vehicle theft. Larceny theft involves the successful or attempted taking of property from another; it includes shoplifting, pocket-picking, purse-snatching and bicycle theft. Burglary involves the unlawful entry into a structure such as a home or business. The summer months (June, July, August and September), have the most property crimes, followed by December.
| Period | Burglary (1) |
Larceny-theft |
Motor vehicle theft |
Total property crime |
|---|---|---|---|---|
| Jan.-Dec. | 1,869,765 |
5,397,426 |
709,384 |
7,976,575 |
| Jan. | 144,227 |
402,015 |
60,146 |
606,388 |
| Feb. | 118,218 |
354,216 |
50,587 |
523,021 |
| Mar. | 144,538 |
443,917 |
60,722 |
649,177 |
| Apr. | 146,333 |
428,092 |
56,047 |
630,472 |
| May. | 155,944 |
455,838 |
58,937 |
670,719 |
| June. | 161,702 |
497,588 |
62,468 |
721,758 |
| Jul. | 170,504 |
487,613 |
62,847 |
720,964 |
| Aug. | 169,490 |
485,564 |
62,451 |
717,505 |
| Sep. | 167,788 |
490,612 |
61,079 |
719,479 |
| Oct. |
163,811 |
458,746 |
58,625 |
681,182 |
| Nov. | 160,797 |
427,809 |
56,251 |
644,857 |
| Dec. | 166,413 |
465,416 |
59,224 |
691,053 |
(1) The States of Alabama, Florida, and Minnesota did not provide monthly breakdowns for offense and are not included in the monthly variation.
Source: U.S. Department of Justice, Federal Bureau of Investigation.
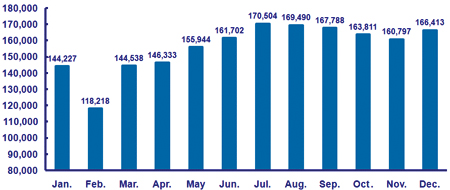
There are the greatest number of burglaries in the summer months of July, August, and September, followed by December.
BURGLARY BY MONTH, 2009 (1)
(1) The states of Alabama, Florida, and Minnesota did not provide monthly breakdowns for offense and are not included in the monthly variations.
Source: U.S. Department of Justice, Federal Bureau of Investigation.
CRIME: PROPERTY
The Federal Bureau of Investigation’s Uniform Crime Reports defines property crime as larceny-theft, motor vehicle theft and burglary. These crimes involve the unlawful taking of money or property without the use of force or threat of force against the victims. Larceny theft involves the successful or attempted taking of property from another; it includes shoplifting, pocket-picking, purse-snatching and bicycle theft. While the theft of motor vehicles is a separate offense category, the thefts of motor vehicle parts and accessories are considered larceny. Burglary involves the unlawful entry into a structure such as a home or business. The burglary rate for renters was about 50 percent higher for renters than owners from 2003 to 2007, according to a 2010 Bureau of Justice Statistics report. Home burglaries accounted for 74 percent of burglary offenses in 2010, according to the FBI. According to a 2010 Bureau of Justice Statistics special report, the risk of burglary was higher for renters than for owners whether or not someone was home based on 2003-2007 data. The report is posted on the Web at http://bjs.ojp.usdoj.gov/content/pub/pdf/vdhb.pdf
NUMBER AND RATE OF PROPERTY CRIME OFFENSES IN THE UNITED STATES, 2001-2010 (1)
Burglary |
Larceny-theft |
|||
|---|---|---|---|---|
| Year | Number |
Rate |
Number |
Rate |
| 2001 | 2,116,531 |
741.8 |
7,092,267 |
2,485.7 |
| 2002 | 2,151,252 |
747.0 |
7,057,379 |
2,450.7 |
| 2003 | 2,154,834 |
741.0 |
7,026,802 |
2,416.5 |
| 2004 | 2,144,446 |
730.3 |
6,937,089 |
2,362.3 |
| 2005 | 2,155,448 |
726.9 |
6,783,447 |
2,287.8 |
| 2006 | 2,194,993 |
733.1 |
6,626,363 |
2,213.2 |
| 2007 | 2,190,198 |
726.1 |
6,591,542 |
2,185.4 |
| 2008 | 2,228,887 |
733.0 |
6,586,206 |
2,166.1 |
| 2009 | 2,203,313 |
717.7 |
6,338,095 |
2,064.5 |
| 2010 | 2,159,878 |
699.6 |
6,185,867 |
2,003.5 |
Motor vehicle theft |
Total property crime (2) |
|||
| Year | Number |
Rate |
Number |
Rate |
| 2001 | 1,228,391 |
430.5 |
10,437,189 |
3,658.1 |
| 2002 | 1,246,646 |
432.9 |
10,455,277 |
3,630.6 |
| 2003 | 1,261,226 |
433.7 |
10,442,862 |
3,591.2 |
| 2004 | 1,237,851 |
421.5 |
10,319,386 |
3,514.1 |
| 2005 | 1,235,859 |
416.8 |
10,174,754 |
3,431.5 |
| 2006 | 1,198,245 |
400.2 |
10,019,601 |
3,346.6 |
| 2007 | 1,100,472 |
364.9 |
9,882,212 |
3,276.4 |
| 2008 | 959,059 |
315.4 |
9,774,152 |
3,214.6 |
| 2009 | 795,652 |
259.2 |
9,337,060 |
3,041.3 |
| 2010 | 737,142 |
238.8 |
9,082,887 |
2,941.9 |
(1) Rate is per 100,000 inhabitants.
(2) Property crimes are the offenses of burglary, larceny-theft and motor vehicle theft.
Source: U.S. Department of Justice, Federal Bureau of Investigation, Uniform Crime Reports.
TOP TEN U.S. METROPOLITAN STATISTICAL AREAS WITH HIGHEST MOTOR VEHICLE THEFT RATES, 2010
| Rank | Metropolitan Statistical Area (1) |
Vehicles stolen |
Rate (2) |
|---|---|---|---|
| 1 | Fresno, CA |
7,559 |
812.40 |
| 2 | Modesto, CA |
3,878 |
753.81 |
| 3 | Bakersfield, CA |
5,623 |
669.70 |
| 4 | Spokane, WA |
2,673 |
586.35 |
| 5 | Vallejo-Fairfield, CA |
2,392 |
578.69 |
| 6 | Sacramento-Arden-Arcade-Roseville, CA |
11,881 |
552.83 |
| 7 | Stockton, CA |
3,779 |
551.43 |
| 8 | Visalia-Porterville, CA |
2,409 |
544.80 |
| 9 | San Francisco-Oakland-Fremont, CA |
22,617 |
521.68 |
| 10 | Yakima, WA |
1,266 |
520.49 |
(1) Metropolitan statistical areas are designated by the federal Office of Management and Budget and usually include areas
much larger than the cities for which they are named.
(2) Ranked by the rate of vehicle thefts reported per 100,000 people based on the 2010 U.S. Census Population Estimates.
Source: National Insurance Crime Bureau.
TOP TEN MOST FREQUENTLY STOLEN PASSENGER VEHICLES, 2010
| Rank | Year/make/model |
|---|---|
| 1 | 1994 Honda Accord |
| 2 | 1995 Honda Civic |
| 3 | 1991 Toyota Camry |
| 4 | 1999 Chevrolet Pickup (Full size) |
| 5 | 1997 Ford F-150 Pickup |
| 6 | 2004 Dodge Ram Pickup |
| 7 | 2000 Dodge Caravan |
| 8 | 1994 Acura Integra |
| 9 | 2002 Ford Explorer |
| 10 | 1999 Ford Taurus |
Source: National Insurance Crime Bureau.
ARSON
Arson, the act of deliberately setting fire to a building, car or other property for fraudulent or malicious purposes, is a crime in all states.
Arson, the act of deliberately setting fire to a building, car or other property for fraudulent or malicious purposes, is a crime in all states.
Church arsons, a major problem in the 1980s, have dropped significantly. Intentional fires in religious and funeral properties fell 82 percent from 1,320 in 1980 to 240 in 2002, the last time such figures were tracked. Structural fires in houses of worship caused $102 million in property damage from 2004-2008, according to the National Fire Protection Association.
INTENTIONALLY SET FIRES, 2001-2010
| Structures | Vehicles | |||
|---|---|---|---|---|
| Year | Number of fires |
Property loss ($ millions) (1) |
Number of fires |
Property loss ($ millions) |
| 2001 | 45,500 |
$34,453 (2) |
39,500 |
$219 |
| 2002 | 44,500 |
919 |
41,000 |
222 |
| 2003 | 37,500 |
692 |
30,500 |
132 |
| 2004 | 36,500 |
714 |
36,000 |
165 |
| 2005 | 31,500 |
664 |
21,000 |
113 |
| 2006 | 31,100 |
755 |
20,500 |
134 |
| 2007 | 32,500 |
733 |
20,500 |
145 |
| 2008 | 30,500 |
866 |
17,500 |
139 |
| 2009 | 26,500 |
684 |
15,000 |
108 |
| 2010 | 27,500 |
585 |
14,000 |
89 |
(1) Includes overall direct property loss to contents, structures, vehicles, machinery, vegetation or any other property involved in a fire.
Does not include indirect losses, such as business interruption or temporary shelter costs.
(2) Includes the events of September 11, 2001, which accounted for $33.44 billion in property losses.
Source: National Fire Protection Association.
In 2010 property loss from intentionally set structure fires decreased 14.5 percent, although the number of arson fires rose 3.8 percent.
Most arson fires are started by vandals. Between 20 and 25 percent are drug related. More than one-third are set by children under the age of 18.