|
||||||||||||||||||||||||||||||||||||||||||||||||||||||||||||||||||||||||||||||||||||||||||||||||||||||||||||||||||||||||||||||||||||||||||||||||||||||||||||||||||||||||||||||||||||||||||||||||||||
|

Car Manufacturer |
Financing APR Q4 2014 |
Lease APR (inferred interest rate) Q4 2014 |
Chevrolet |
1.90% |
1.32% |
Mitsubishi |
0.00% |
3.31% |
Honda |
0.90% |
3.67% |
Nissan |
0.00% |
4.74% |
Kia |
0.00% |
5.27% |
BMW |
3.12% |
2.26% |
Acura |
0.90% |
4.53% |
Buick |
1.85% |
4.13% |
Infiniti |
2.49% |
4.68% |
Mazda |
0.90% |
6.36% |
Toyota |
1.90% |
5.66% |
Volkswagen |
2.90% |
5.68% |
Ford |
3.94% |
4.71% |
Volvo |
1.90% |
7.23% |
Hyundai |
2.90% |
6.37% |
Audi |
2.90% |
6.41% |
Mini |
1.90% |
7.89% |
Chrysler |
1.98% |
8.28% |
Subaru |
2.99% |
8.01% |
Mercedes |
2.99% |
9.28% |
Dodge |
1.99% |
10.64% |
Average |
1.92% |
5.73% |
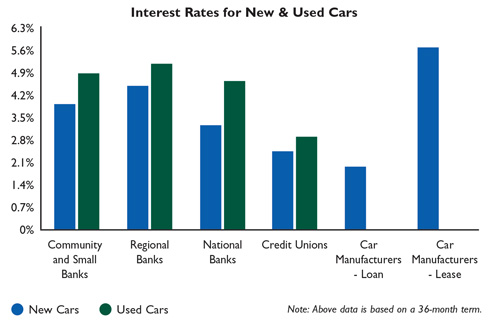
Note: Above data is based on a 36-month term. The APRs presented for the financing and lease programs of the car manufactures are only informative. The actual values that one can obtain are based on various factors, including credit worthiness, income, location, promotional programs and, believe it or not, negotiation skills. Make sure to always check upfront with a dealer about the availability of any discounts for particular groups (i.e. USAA members) that you might qualify for as well as whether any other costs and/or restrictions may be imposed, especially in the case of lease contracts.
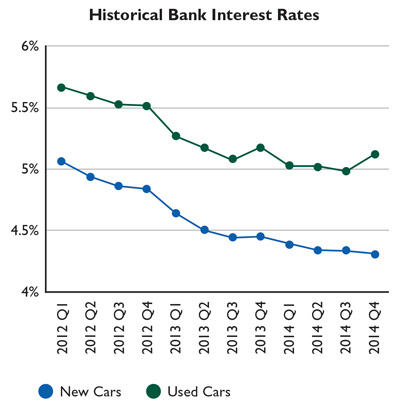
Rates over Time
Q1 2014 (vs. last yr) |
Q2 2014 (vs. last yr) |
Q3 2014 (vs. last yr) |
Q4 2014 (vs. last yr) |
Q4 vs. Q3 Change |
|
| Banks - New Cars | 4.39% (-5.26%) |
4.34% (-3.74%) |
4.33% (-2.55%) |
4.31% (-3.20%) |
-0.47% |
| Bank - Used Cars | 5.03% (-4.65%) |
5.02% (-2.84%) |
4.98% (-2.04%) |
5.12% (-1.16%) |
2.88% |
| Credit Unions - New Cars | 2.51% (N/A) |
2.48% (N/A) |
2.47% (N/A) |
2.44% (-2.87%) |
-1.27% |
| Credit Union - Used Cars | 2.98% (N/A) |
2.96% (N/A) |
2.95% (N/A) |
2.93% (-1.65%) |
-0.71% |
| Car Manufacturers - New Car Financing | N/A (N/A) |
N/A (N/A) |
N/A (N/A) |
1.92% (-21.89%) |
N/A |
| Car Manufacturers - Leasing | N/A (N/A) |
N/A (N/A) |
N/A (N/A) |
5.73% (31.84%) |
N/A |
Note: Above data is based on a 36-month term.
Excellent vs Fair Credit Score
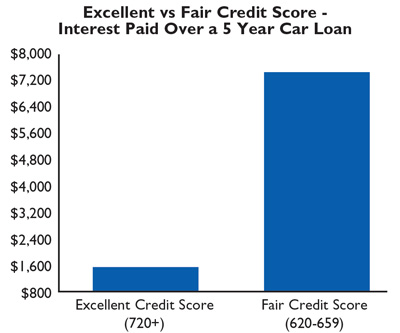
Note: Above data reflects a $20,000 5-year loan for a new car with a fixed interest rate, using WalletHub’s interest rate data from Q4 2014.
| Credit Score | Q1 2014 |
Q2 2014 |
Q3 2014 |
Q4 2014 |
| New cars - Excellent credit score (720+) | 3.07% |
3.09% |
3.02% |
3.00% |
| New cars - Fair credit score (620-659) | 13.38% |
13.44% |
13.76% |
13.30% |
| Used cars - Excellent credit score (720+) | 3.87% |
3.32% |
3.75% |
3.75% |
| Used cars - Fair credit score (620-659) | 13.51% |
13.58% |
13.95% |
13.40% |
Manufacturer Transparency
Leasing offers are the most difficult type of car purchasing arrangement for consumers to understand, as they lack the equivalent of an APR that can be used for comparison purposes. As a result, the transparency of manufacturers about these deals is integral to the consumer’s ability to make informed decisions.
| Manufacturer | Transparency Score |
Manufacturer | Transparency Score |
|
| Mazda | 6 |
Buick | 3 |
|
| Infiniti | 6 |
Acura | 3 |
|
| Mini | 6 |
Ford | 3 |
|
| Honda | 3 |
Dodge | 3 |
|
| Toyota | 3 |
Audi | 3 |
|
| Volkswagen | 3 |
Mercedes | 3 |
|
| Chevrolet | 3 |
Volvo | 3 |
|
| BMW | 3 |
Mitsubishi | 3 |
|
| Nissan | 3 |
Hyundai | 1 |
|
| Kia | 3 |
Subaru | 1 |
|
| Chrysler | 3 |
Raz Daraban • Communications Manager, WalletHub
![]()