|
||
|
 |
If your wallet feels a little heavier these days it probably is because you have been spending a lot less at the pump. According to the Car Care Council, if you spend some of that gas savings on auto care you can save even more in the long run.
“Gas prices are lower than they have been for nearly six years and that means big savings for motorists,” said Rich White, executive director, Car Care Council. “Add to that a proactive auto care plan and you will not only save more now, but as gas prices start to rise again, you’ll save later. All because you invested in your vehicle to make sure it runs efficiently.”
The non-profit Car Care Council encourages motorists to be car care aware and perform simple steps to improve fuel economy and save money.

Engine Performance: Keep your engine running efficiently and improve gas mileage by an average of 4 percent.
Tire Pressure: Keep tires properly inflated and improve gas mileage by up to 3.3 percent.
Motor Oil: Improve gas mileage by 1 to 2 percent by using the grade of motor oil recommended by the manufacturer.
Air Filters: Replacing clogged air filters on older vehicles can improve fuel economy and will improve performance and acceleration on all vehicles.
Gas Cap: Damaged, loose or missing gas caps allow gas to vaporize into the air.
Fix It: Addressing a serious maintenance problem, like a faulty oxygen sensor, can improve mileage by as much as 40 percent, according to www.fueleconomy.gov.
In addition to vehicle maintenance, modifying driving habits, such as observing the speed limit and avoiding quick stops and starts, can also increase fuel efficiency.
Consolidating trips, avoiding excessive idling and removing unnecessary items from the trunk are also easy ways to lower fuel consumption.
To help motorists increase fuel economy and take better care of their vehicles, the Car Care Council offers valuable tools on its website, including a free personalized schedule and email reminder service. Single copies of the recently updated 80 page Car Care Guide can be ordered free of charge at www.carcare.org/car-care-guide.
The Car Care Council is the source of information for the “Be Car Care Aware” consumer education campaign promoting the benefits of regular vehicle care, maintenance and repair to consumers. For a free copy of the council’s popular Car Care Guide or for more information, visit www.carcare.org.
The Car Care Council

GASOLINE EXPLAINED
Factors affecting Gasoline Prices
The single biggest factor in the price of gasoline is the cost of the crude oil from which it is refined. U.S. Energy Information Administration (EIA) analysis of the petroleum market points to fluctuations in the price of crude oil as the main contributor to the substantial changes in gasoline prices experienced by the United States in recent years. Crude oil prices are greatly affected by levels of supply relative to actual and expected demand for the petroleum products made from crude oil.
Crude oil is a global commodity where prices are determined by the world market. Strong global demand growth for petroleum in the mid-2000s was a major factor in record high prices for crude oil and gasoline in mid-2008. Supply disruptions also led to spikes in crude oil and gasoline prices. Major disruptions were caused by hurricanes and storms, political events in major oil producing countries, and unplanned outages in U.S. refineries and pipelines.
Gasoline is often more expensive in the summer because more costly summer blends are supplied, and also because demand is generally higher. U.S. refineries often conduct planned maintenance in the spring that can lead to a drop in gasoline production. This makes supplies more vulnerable if unplanned refinery outages occur. Supply disruptions as a result of unplanned refinery outages often result in higher prices.
The U.S. economic recession and a rise in the use of more fuel efficient vehicles contributed to lower demand for gasoline in recent years. To learn more about how personal travel growth influences transportation energy demand, read the April 16, 2014 Today in Energy article. Increases in U.S. oil production also helped to reduce upward pressure on oil and gasoline prices in the past several years.
There are three main grades of gasoline, based on octane levels:
- Regular
- Midgrade
- Premium
The octane level of a fuel refers to its resistance to combustion. A fuel with a higher octane level is less prone to pre-ignition and detonation, also known as engine knocking. Premium grade is the most expensive. The price difference between grades is typically about 10¢ per gallon.
What are the main components of the retail price of gasoline?
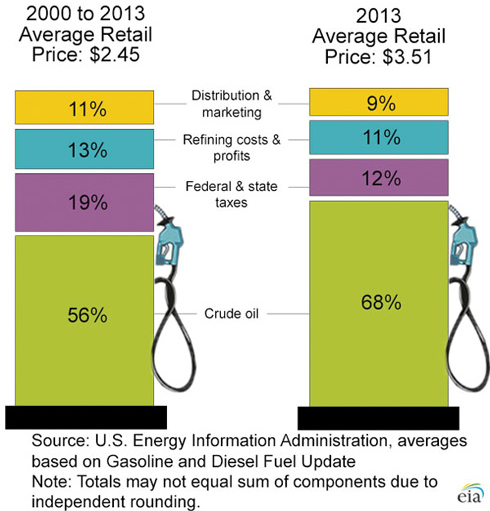
The retail price of gasoline includes four main components:
- The cost of crude oil
- Refining costs and profits
- Distribution and marketing costs and profits
- Taxes
Retail pump prices reflect these costs, as well as the profits (and sometimes losses) of refiners, marketers, distributors, and retail station owners.
What determines the cost of crude oil?
The cost of crude oil as a share of the retail gasoline price varies over time and also varies among regions of the country. Crude oil prices are determined by both demand and supply. World economic growth is the most significant factor affecting demand.
A major factor on supply is the Organization of the Petroleum Exporting Countries (OPEC), which can sometimes exert significant influence on prices by setting an upper production limit on its members. OPEC produced about 43% of the world’s crude oil in 2013.
OPEC countries maintain nearly all of the world’s spare oil production capacity, and possess almost three fourths of the world’s estimated proved crude oil reserves. Oil prices often spike in response to disruptions in the international and domestic supply of crude oil.
What do we pay for in a gallon of regular grade gasoline?
Taxes add to the price of gasoline
Federal, state, and local government taxes also contribute to the retail price of gasoline. Federal excise taxes are currently 18.4¢ per gallon. As of January 1, 2014, state excise taxes averaged 24.17¢ per gallon, and 12 states levied additional state sales and other taxes on gasoline. Additional county and city taxes can have a significant impact on the price of gasoline in some locations.
Refining costs and profits
Refining costs and profits vary from region to region in the United States partly because of the different gasoline formulations required in different parts of the country. The characteristics of the gasoline produced depend on the type of crude oil that is used and the type of processing technology available at the refinery where it is produced. Gasoline prices are also affected by the cost of other ingredients that may be blended into gasoline such as ethanol.
Distribution, marketing, and retail dealer costs and profits are also included in the retail price of gasoline. Most gasoline is shipped from the refinery first by pipeline to terminals near consuming areas where it may be blended with other products such as ethanol to meet local government and market specifications. Gasoline is then delivered by tanker truck to individual gasoline stations.
Some retail outlets are owned and operated by refiners, while others are independent businesses that purchase gasoline from refiners and marketers for resale to the public. The price at the pump also reflects local market conditions and factors, such as the desirability of the location and the marketing strategy of the owner.
The cost of doing business by individual dealers can vary greatly depending on where the dealer is located. These costs include wages and salaries, benefits, equipment, lease or rent payments, insurance, overhead, and state and local fees. Even retail stations next to each other can have different traffic patterns, rent, and sources of supply that affect their prices. The number and location of local competitors can also affect prices
U.S. ENERGY FACTS EXPLAINED
Americans use many types of energy
Petroleum (oil) is the largest share of U.S. primary energy consumption followed by:
- natural gas,
- coal,
- nuclear electric power, and
- renewable energy, including
- hydropower,
- wood,
- biofuels,
- biomass waste,
- wind,
- geothermal, and
- solar.
Electricity is a secondary energy source that is generated from primary forms of energy.
Energy sources are commonly measured in different physical units to include barrels of oil, cubic feet of natural gas, tons of coal, and kilowatthours of electricity.
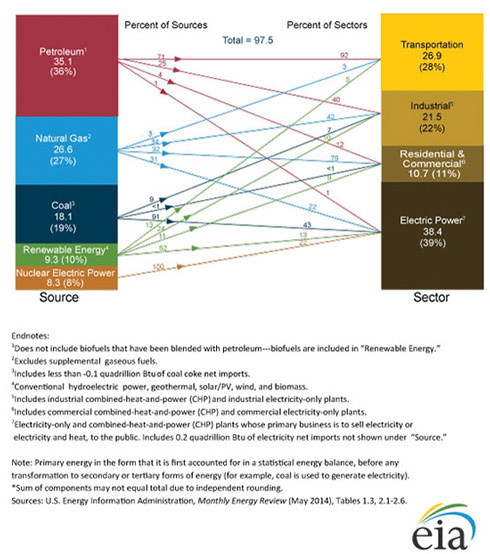
In the United States, British thermal units (Btu), a measure of heat energy, is commonly used for comparing different types of energy. In 2013, total U.S. primary energy use was about 97.5 quadrillion (1015, or one thousand trillion) Btu.
The major energy users are residential and commercial buildings, industry, transportation, and electric power generators. The pattern of fuel use varies widely by sector. For example, petroleum oil provides 92% of the energy used for transportation, but only 1% of the energy used to generate electricity.
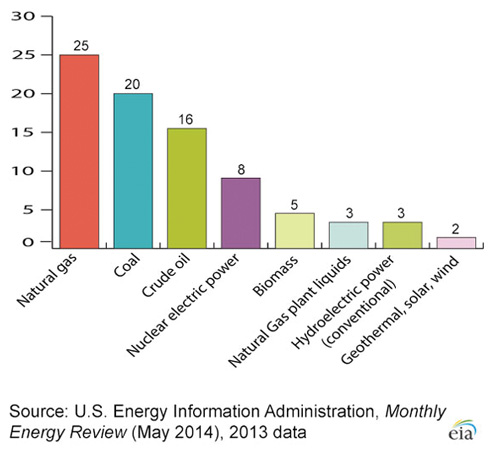
U.S. energy consumption by energy source, 2013

Domestic energy production meets about 84% of U.S. energy demand
In 2013, energy produced in the United States provided about 84% of the nation’s energy needs. The remaining energy was supplied mainly by imports of petroleum.
The three major fossil fuels—petroleum, natural gas, and coal—accounted for most of the nation’s energy production in 2013:
- Natural gas—30%
- Coal—24%
- Petroleum (crude oil and natural gas plant liquids)—24%
- Renewable energy—11%
- Nuclear electric power—10%
Primary energy consumption by source and sector, 2013
quadrillion Btu
The mix of U.S. energy production changes
The three major fossil fuels—petroleum, natural gas, and coal—have dominated the U.S. energy mix for more than 100 years.
There are several recent changes in U.S. energy production:
- The share of coal produced from surface mines increased significantly from 25% in 1949 to 51% in 1971 to 66% in 2012. The remaining share was produced from underground mines.
- In 2013, natural gas production was higher than in any previous year. In recent years, more efficient and cost effective drilling and production techniques
have resulted in increased production of natural gas from shale formations.
- Total U.S. crude oil production generally decreased each year from a peak in 1970, but the trend reversed in 2010. In 2013, crude oil production was the highest since 1989. These increases were the result of increased use of horizontal drilling and hydraulic fracturing techniques, most notably in North Dakota and Texas.
- Natural gas plant liquids (NGPL) are hydrocarbons that are separated as liquids from natural gas at processing plants. They are important ingredients for manufacturing plastics and gasoline.
- Propane is the only NGPL that is widely used for heating and cooking. Production of NGPL fluctuates with natural gas production, but the NGPL share of total U.S. crude oil and petroleum field production increased from 8% in 1950 to 26% in 2013.
- In 2013, total renewable energy production and consumption reached record highs of about 9 quadrillion Btu each. Hydroelectric power production in 2013 was about 9% below the 50-year average, but increases in biofuels use and wind power generation increased the overall total contribution of renewable energy. Production of energy from wind and solar were at record highs in 2013.
U.S. primary energy production by major source, 2013
quadrillion Btu