|
||
THERE ARE FOUR SEPARATE SOCIAL SECURITY TRUST FUNDS:
|
"...by 2017, net revenue flows from the general fund will total $449 billion (2.0 percent of GDP). The positive amounts that begin in 2017 for OASDI, and in 2008 for HI, initially represent payments the Treasury must make to the trust funds when assets are redeemed to help pay benefits in years prior to exhaustion of the funds. Note that neither the redemption of trust fund bonds, nor interest paid on those bonds, provides any new net income to the Treasury, which must finance redemptions and interest payments through some combination of increased taxation, reductions in other government spending, or additional borrowing from the public." " The projected combined Social Security and Medicare deficits and statutory general fund revenues in 2082 equal 9.3 percent of GDP, indicating the magnitude of the potential effect on the Federal budget if general revenues were used to ensure payment of all scheduled program benefits. A similar burden today would require more than 80 percent of all Federal income tax revenues, which amounted to 11.2 percent of GDP in 2007." " To put these magnitudes into historical perspective, in 2007 the combined annual cost of HI, SMI, and OASDI amounted to 38 percent of total Federal revenues, or about 7 percent of GDP. That cost (as a percentage of GDP) is projected to double by 2060, and then to increase further to nearly 17 percent of GDP in 2082. It is noteworthy that over the past four decades, the average amount of total Federal revenue as a percentage of GDP has been 18 percent, and has not exceeded 21 percent in a given year. Assuming the continued need to fund a wide range of other government functions, the projected growth in Social Security and Medicare costs would require that the total Federal revenue share of GDP increase to wholly unprecedented levels." |
Each year the Trustees of the Social Security and Medicare trust funds report on the current and projected financial status of the two programs. This message summarizes our 2008 Annual Reports.
The financial condition of the Social Security and Medicare programs remains problematic. Projected long run program costs are not sustainable under current financing arrangements. Social Security's current annual surpluses of tax income over expenditures will begin to decline in 2011 and then turn into rapidly growing deficits as the baby boom generation retires. Medicare's financial status is even worse. This year Medicare's Hospital Insurance (HI) Trust Fund is expected to pay out more in hospital benefits and other expenditures than it receives in taxes and other dedicated revenues. The difference will be made up from general revenues which pay for interest credits to the Trust Fund. Growing annual deficits are projected to exhaust HI reserves in 2019 and Social Security reserves in 2041. In addition, the Medicare Supplementary Medical Insurance (SMI) Trust Fund that pays for physician services and the prescription drug benefit will continue to require general revenue financing and charges on beneficiaries that grow substantially faster than the economy and beneficiary incomes over time.
The drawdown of Social Security and HI Trust Fund reserves and the general revenue transfers into SMI will result in mounting pressure on the Federal budget. In fact, pressure is already evident. For the second consecutive year, a "Medicare funding warning" is being triggered, signaling that non dedicated sources of revenues— primarily general revenues—will soon account for more than 45 percent of Medicare's outlays. The President recently proposed remedial action pursuant to the warning in last year's report and, in accordance with Medicare statute, a Presidential proposal will be needed in response to the latest warning.
We are increasingly concerned about inaction on the financial challenges facing the Social Security and Medicare programs. The longer action is delayed, the greater will be the required adjustments, the larger the burden on future generations, and the more severe the detrimental economic impact on our nation.
Medicare
As we reported last year, Medicare's financial difficulties come sooner—and are much more severe—than those confronting Social Security. While both programs face demographic challenges, rapidly growing health care costs also affect Medicare. Underlying health care costs per enrollee are projected to rise faster than the wages per worker on which payroll taxes and Social Security benefits are based. As a result, while Medicare's annual costs were 3.2 percent of GDP in 2007, or nearly three quarters of Social Security's, they are projected to surpass Social Security expenditures in 2028 and reach 10.8 percent of GDP in 2082.
Moreover, this is the second consecutive year that the Medicare Report triggers a Medicare funding warning. Under the Medicare Prescription Drug, Improvement, and Modernization Act of 2003 the Medicare Report must include a determination of whether the difference between total Medicare outlays and dedicated financing (such as premiums and payroll taxes) exceeds 45 percent of total outlays within the first 7 years of the projection period (2008-2014 for the 2008 Report). The Act provides that an affirmative determination in two consecutive reports be treated as a "funding warning" for Medicare that would, in turn, prompt a Presidential proposal to respond to the warning and expedited Congressional consideration of such proposal. The 2008 Report projects that the difference will surpass 45 percent in 2014 and therefore again makes a determination of excess general revenue funding (as prior Reports did in 2006 and 2007). This determination triggers the second consecutive Medicare funding warning. Under the provisions of the 2003 Act, this calls for a Presidential proposal to respond to the warning within 15 days of the submission of the Fiscal Year 2010 budget and for Congress to consider the proposal on an expedited basis. This provision is expected to bring additional attention to Medicare's impact on the Federal budget.
The projected 75-year actuarial deficit in the Hospital Insurance (HI) Trust Fund is now 3.54 percent of taxable payroll, down slightly from 3.55 percent projected in last year's report. Were it not for new methods for projecting immigration that were implemented this year, the HI actuarial deficit would have increased rather than decreased. Despite the slight improvement, the fund again fails our test of short-range financial adequacy, as projected annual assets drop below projected annual expenditures within 10 years—by 2013. The fund also continues to fail our long-range test of close actuarial balance by a wide margin. The projected date of HI Trust Fund exhaustion is 2019, the same as in last year's report, when dedicated revenues would be sufficient to pay only 78 percent of HI costs. Projected HI dedicated revenues fall short of outlays in this and all future years.
The Medicare Report shows that the program could be brought into actuarial balance over the next 75 years by an immediate 122 percent increase in the payroll tax (from 2.9 percent to 6.44 percent), or an immediate 51 percent reduction in program outlays or some combination of the two. As with Social Security, adjustments of greater magnitude would be necessary if changes are delayed or phased in gradually. Larger changes would also be required to make the program solvent on a sustainable basis beyond the 75-year horizon.
Part B of the Supplementary Medical Insurance (SMI) Trust Fund, which pays doctors' bills and other outpatient expenses, and Part D, which pays for access to prescription drug coverage, are both projected to remain adequately financed into the indefinite future because current law automatically provides financing each year to meet next year's expected costs. However, expected steep cost increases will result in rapidly growing general revenue financing needs—projected to rise from 1.3 percent of GDP in 2007 to 4.1 percent in 2082—as well as substantial increases over time in beneficiary premium charges.
Social Security
The annual cost of Social Security benefits represented 4.3 percent of Gross Domestic Product (GDP) in 2007 and is projected to increase to 6.1 percent of GDP in 2035, and then decline to 5.8 percent of GDP by 2048 and remain at that level. The projected 75-year actuarial deficit in the combined Old-Age and Survivors and Disability Insurance (OASDI) Trust Fund is 1.70 percent of taxable payroll ($4.3 trillion in present value terms), down from 1.95 percent projected in last year's report. This decrease is due primarily to changes in projection methods. Although the combined OASDI program passes our short-range test of financial adequacy, the Disability Insurance Trust Fund does not; in addition, OASDI continues to fail our long-range test of close actuarial balance by a wide margin. Projected OASDI tax income will begin to fall short of outlays in 2017, and will be sufficient to finance only 78 percent of scheduled annual benefits in 2041, after the combined OASDI Trust Fund is projected to be exhausted.
Social Security could be brought into actuarial balance over the next 75 years in various ways, including an immediate increase of 14 percent in payroll tax revenues (from 12.4 percent to 14.1 percent) or an immediate reduction in benefits of 12 percent or some combination of the two. Ensuring that the system is solvent on a sustainable basis beyond the next 75 years would require larger changes, because an aging population and increasing longevity cause the projected current-law OASDI cash-flow deficits to be substantially larger after the 75-year projection period than they are on average during the period.
The projected actuarial deficit in the OASDI Trust Fund over the infinite future is 3.2 percent of taxable payroll (1.1 percent of GDP), or $13.6 trillion in present value terms. The system could be brought into actuarial balance over this time horizon with an immediate increase in payroll tax revenues of 26 percent (from 12.4 percent to 15.6 percent) or an immediate reduction in benefits of 20 percent, or some combination of the two.
Conclusion
The financial difficulties facing Social Security and Medicare pose enormous challenges. The sooner these challenges are addressed, the more varied and less disruptive their solutions can be. We urge the public to engage in informed discussion and policymakers to think creatively about the changing needs and preferences of working and retired Americans. A national conversation and timely political action are essential to ensure that Social Security and Medicare continue to play a critical role in the lives of all Americans.
By the Trustees:
Henry M. Paulson, Jr.,
Secretary of the Treasury, and Managing Trustee
Elaine L. Chao,
Secretary of Labor, and Trustee
Michael O. Leavitt,
Secretary of Health and Human Services, and Trustee
Michael J. Astrue,
Commissioner of Social Security, and Trustee
A SUMMARY OF THE 2008 ANNUAL SOCIAL SECURITY AND MEDICARE TRUST FUND REPORTS
Who Are the Trustees? There are six Trustees, four of whom serve by virtue of their positions in the Federal Government: the Secretary of the Treasury, the Secretary of Labor, the Secretary of Health and Human Services, and the Commissioner of Social Security. The other two Trustees are public representatives appointed by the President, subject to confirmation by the Senate. The two Public Trustee positions are currently vacant.
What Are the Trust Funds? Congress established the trust funds in the U.S. Treasury to account for all program income and disbursements. Social Security and Medicare taxes, premiums, and other income are credited to the funds. Disbursements from the funds can be made only to pay benefits and program administrative costs.
The Department of the Treasury invests program revenues not needed in the current year to pay benefits and administrative costs in special non-marketable securities of the U.S. Government on which a market rate of interest is credited. Thus, the trust funds represent the accumulated value, including interest, of all prior program annual surpluses and deficits, and provide automatic authority to pay benefits.
There are four separate trust funds. For Social Security, the Old-Age and Survivors Insurance (OASI) Trust Fund pays retirement and survivors benefits, and the Disability Insurance (DI) Trust Fund pays disability benefits. (The two trust funds are often considered on a combined basis designated OASDI.) For Medicare, the Hospital Insurance (HI) Trust Fund pays for inpatient hospital and related care. The Supplementary Medical Insurance (SMI) Trust Fund comprises two separate accounts: Part B, which pays for physician and outpatient services, and Part D, which covers the prescription drug benefit.
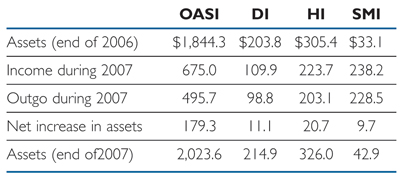
What Were the Trust Fund Results in 2007? In December 2007, 40.9 million people received OASI benefits, 8.9 million received DI benefits, and 44.1 million were covered under Medicare. Trust fund operations, in billions of dollars, are shown below (totals may not add due to rounding). All four trust funds showed net increases in assets in 2007.
How Has the Financial Outlook for Social Security and Medicare Changed Since Last Year? Under the intermediate assumptions, the combined OASDI Trust Funds show a 75-year actuarial deficit equal to 1.70 percent of taxable payroll, 0.26 percentage point smaller than last year's estimate. The difference is due mainly to changes in methods used to project immigration. The revised methods result in persistently lower projected costs as a percentage of payroll. Over the infinite horizon, the actuarial deficit is 3.2 percent of projected payroll, 0.3 percentage point smaller than last year. The OASI Trust Fund and the combined OASI and DI Trust Funds are adequately financed over the next 10 years. The DI Trust Fund is expected to remain solvent over the next 10 years, but does not meet the short-range test for financial adequacy because its assets are projected to fall short of 100 percent of annual expenditures, reaching 95 percent at the end of 2017.
Medicare's HI Trust Fund has a projected 75-year actuarial deficit equal to 3.54 percent of payroll under the intermediate assumptions, nearly the same as reported last year (3.55 percent). The HI Trust Fund is expected to remain solvent over the next 10 years, but does not meet the short-range test of financial adequacy; its assets are projected to fall short of 100 percent of annual expenditures by 2013. If the annual growth in HI expenditures averages 7.4 percent during 2008-17 as expected, HI Trust Fund assets would fall to 39 percent of annual HI expenditures in 2017.
The SMI Trust Fund is adequately financed under current law because of the automatic financing established for Medicare Parts B and D. Nonetheless, projected SMI cost growth over the long term will require increases in enrollee premiums and general revenue funding that will average about 6.5 percent annually, placing an ever-increasing burden on beneficiaries andn Federal revenues.
This year's Medicare Trustees Report is the third consecutive report in which the annual general revenue funding contribution to total Medicare expenditures is projected to exceed 45 percent within the first 7 years of the 75-year projection period. This result triggers another "Medicare funding warning."
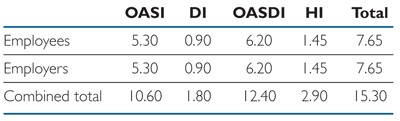
How Are Social Security and Medicare Financed? For OASDI and HI, the major source of financing is payroll taxes on earnings that are paid by employees and their employers. The self employed are charged the equivalent of the combined employer and employee tax rates. During 2007, an estimated 163 million people had earnings covered by Social Security and paid payroll taxes; for Medicare the corresponding figure was 168 million people. The payroll tax rates are set by law and for OASDI apply to earnings up to an annual maximum ($102,000 in 2008) that increases with the growth in the nationwide average wage. HI taxes are paid on total earnings. The payroll tax rates (in percent) for 2008 and later are:
About 75 percent of SMI Part B and Part D expenditures are paid from Federal general fund revenues, with most of the remaining costs covered by monthly premiums charged to enrollees. Part B and Part D premium amounts are based on methods defined in law and increase as the estimated costs of those programs rise.
In 2008, the Part B standard monthly premium paid by most enrollees is $96.40. During 2007-09, an income-related premium surcharge is being phased in for Part B beneficiaries whose modified adjusted gross income exceeds inflation-indexed thresholds (in 2008, $82,000 for individual tax returns, $164,000 for joint returns).
In 2008, the Part D "base monthly premium" is $27.93. (Actual premium amounts charged to Part D beneficiaries depend on the specific plan in which they are enrolled and average $25 for standard coverage in 2008.) Part D also receives payments from States for the Federal assumption of Medicaid responsibilities and Medicaid. In 2008, State payments are estimated to cover 14 percent of Part D costs, but that percentage is projected to decline to 10 percent by 2014 as the State requirement decreases.
Income to each trust fund, by source, in 2007 is shown in the table below (totals may not add due to rounding).

What Were the Administrative Expenses in 2007? Administrative expenses, as a percentage of total expenditures, were:

How Are Estimates of the Trust Funds' Future Status Made? Short-range (10-year) and long-range (75-year) projections are reported for all funds. Estimates are based on current law and assumptions about factors that affect the income and outgo of each trust fund. Assumptions include economic growth, wage growth, inflation, unemployment, fertility, immigration, and mortality, as well as factors relating to disability incidence and the cost of hospital, medical, and prescription drug services.
Because the future is inherently uncertain, three alternative sets of economic, demographic, and programmatic assumptions are used to show a range of possibilities. The intermediate assumptions (alternative II) reflect the Trustees' best estimate of future experience. The low-cost alternative I is more optimistic for trust fund financing, and the high-cost alternative III is more pessimistic; they show trust fund projections for more and less favorable conditions for trust fund financing than the best estimate. The assumptions are reexamined each year in light of recent experience and new information about future trends, and are revised as warranted. In general, greater confidence can be placed in the assumptions and estimates for earlier projection years than for later years. The statistics and analysis presented in this Summary are based on the intermediate assumptions.
What is the Short-Range Outlook (2008-2017) for the Trust Funds? For the short range, the adequacy of the OASI, DI, and HI Trust Funds is measured by comparing their assets at the beginning of a year to projected costs for that year (the "trust fund ratio"). A trust fund ratio of 100 percent or more—that is, assets at least equal to projected benefit payments for a year—is considered a good indicator of a fund's short-term adequacy. That level of projected assets for any year means that even if expenditures exceed income, the trust fund reserves, combined with annual tax revenues, would be sufficient to pay full benefits for several years, allowing time for legislative action to restore financial adequacy.
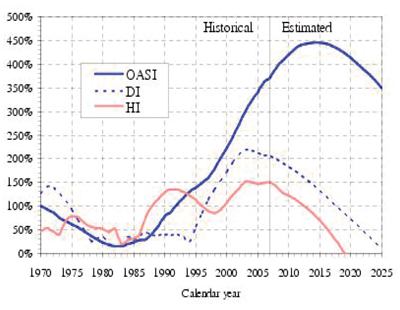
By this measure, the OASI Trust Fund is financially adequate throughout the 2008-2017 period, but the DI Trust Fund fails the shortrange test because its trust fund ratio falls below 100 percent by the end of 2017. The HI Trust Fund also does not meet the short-range test of financial adequacy, with assets projected to fall below 100 percent of one year's outgo by 2013. Chart A shows these trust fund ratios under the intermediate assumptions through 2025.
For SMI Part B, a less stringent annual "contingency reserve" asset test applies because the major portion of the financing for that account is provided by beneficiary premiums and Federal general fund revenue payments automatically adjusted each year to meet expected costs. Part D is similarly financed on an annual basis. Moreover, the operation of Part D through private insurance plans, together with a flexible appropriation for Federal costs, eliminates the need for a contingency reserve in that account. Note, however, that the cost estimates for Part B are very likely to be too low for 2008 and ensuing years (perhaps by 10 to 20 percent in the long range) because they assume that current law governing the structure of physician payment updates will persist. That would lead to substantial reductions in physician payments per service during 2008-17 and slow the growth of projected Part B costs.
Chart A—OASI, DI, and HI Trust Fund Ratios
[Assets as a percentage of annual expenditures]
For each year since 2001, Congress has passed legislation to maintain or increase physician payments rather than allow the current law reductions. Thus, experience indicates that the scheduled reductions are unlikely to occur before legislative intervention. The understated physician payments affect projected costs for Part B, total SMI, and total Medicare.
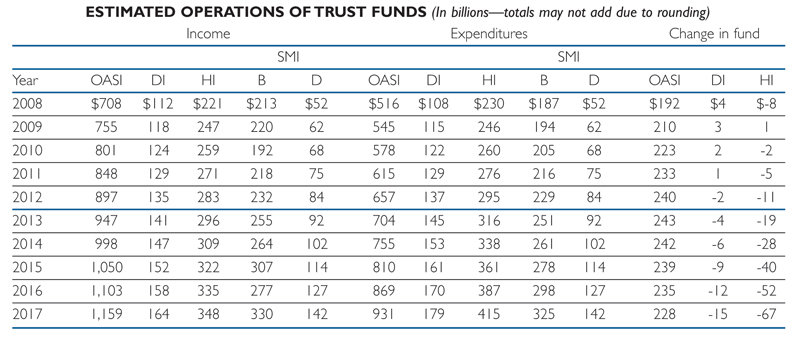
The following table shows the projected income and outgo, and the change in the balance of each trust fund (except for SMI) over the next 10 years. SMI income and expenditures are shown in separate columns for Parts B and D. Changes in the SMI Trust Funds are not shown because of the automatic annual adjustments in program income to meet the following year's projected expenditures.
What is the Long-Range (2008-2082) Outlook for Social Security and Medicare Costs? An instructive way to view the projected cost of Social Security and Medicare is to compare the financing required to pay all scheduled benefits for the two programs with the gross domestic product (GDP), the most frequently used measure of the total output of the U.S. economy. Costs for both programs rise steeply between 2010 and 2030 because the number of people receiving benefits will increase rapidly as the large baby-boom generation retires (Chart B). During those years, cost growth for Medicare is higher than for Social Security because of the rising cost of health services, increasing utilization rates, and anticipated increases in the complexity of services. Beyond 2030, Social Security costs increase slowly for about 5 years, reaching a peak of 6.1 percent of GDP in the middle of the decade. Costs then decline slightly over the following decade to about 5.8 percent of GDP where they remain for the last 35 years of the projection period. In contrast, Medicare costs continue to grow rapidly after 2030 due to expected increases in the cost of health care.
Chart B—Social Security and Medicare Cost as a Percentage of GDP

The projected cost outlook for Social Security and Medicare has improved relative to that described in last year's report. In 2007, the combined cost of the Social Security and Medicare programs represented about 7.5 percent of GDP. Social Security outgo amounted to 4.3 percent of GDP in 2007 and is projected to increase to 5.8 percent of GDP in 2082 (compared to 6.3 percent in 2081 last year). Medicare's cost was smaller in 2007—3.2 percent of GDP— but is projected to surpass the cost of Social Security in 2028, growing to 10.8 percent of GDP in 2082 (compared to 11.3 percent in 2081 last year) when it will be 85 percent larger than Social Security's cost. In 2082, the combined cost of the programs would represent 16.6 percent of GDP. As a point of comparison, in 2007 all Federal receipts amounted to 18.8 percent of GDP.
What is the Outlook for OASDI and HI Costs Relative to Tax Income? Both Medicare and Social Security costs are projected to grow substantially faster than the economy over the next several decades, but tax income to the HI and OASDI Trust Funds will not. Because the primary source of income for HI and OASDI is the payroll tax, it is customary to compare the programs' income and costs expressed as percentages of taxable payroll. These income and cost rates are shown in Chart C. Although both the HI and OASDI annual cost rates increase markedly from their 2007 levels (3.11 and 11.26 percent), income rates increase very little over the long run. The reason is that payroll tax rates are not scheduled to change and income from the other tax source, taxation of OASDI benefits, will increase only gradually as a greater proportion of beneficiaries is subject to taxation in future years.
Chart C—Income and Cost Rates
[Percentage of taxable payroll]

What is the Long-Range Actuarial Balance of the OASI, DI, and HI Trust Funds? The traditional way to view the outlook of the payroll tax financed trust funds is in terms of their actuarial balances for the 75-year valuation period. The actuarial balance of a fund is essentially the difference between annual income and costs, expressed as a percentage of taxable payroll, summarized over the 75-year projection period. Because SMI is brought into balance annually through premium increases and general revenue transfers, actuarial balance is not an informative concept for that program.
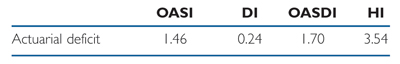
The OASI, DI, and HI Trust Funds all have actuarial deficits under the intermediate assumptions, as shown in the following table. The actuarial deficit can be interpreted as the percentage points that could be either added to the current law income rate or subtracted from the cost rate for each of the next 75 years to bring the funds into actuarial balance. Actuarial balance is achieved if trust fund assets at the end of the period are equal to the following year's expenditures. Because large and growing annual deficits are projected at the end of the long-range period, adequate financing beyond 2082 would require even larger changes than are needed for solvency in 2008-82. Projections show that over the infinite horizon the actuarial deficit for OASDI is 3.2 percent, 1.5 percentage points higher than the 75-year deficit. For HI, the actuarial deficit over the very long run is 6.1 percent of taxable payroll, 2.6 percentage points higher than the 75-year imbalance.
LONG-RANGE ACTUARIAL DEFICIT OF THE OASI, DI, AND HI TRUST FUNDS
(As a percentage of taxable payroll; total may not add due to rounding)
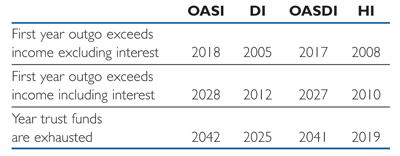
What Are Key Dates in Long-Range OASI, DI, and HI Financing? When cost exceeds income excluding interest (Chart C), use of trust fund assets occurs in stages. For HI, the process begins in 2008 when HI income excluding interest falls short of expenditures, and interest earnings (which are paid from Federal general revenues) must be used to cover the difference. Beginning in 2010, costs are projected to exceed income including interest, and assets must be redeemed each year until the trust fund is exhausted in 2019. The onset of the use of trust fund assets to help finance HI benefits is now expected to start a year earlier than indicated in last year's report. The change is due to a combination of slightly lower payroll tax income and higher short-range HI expenditures than projected in the 2007 Report. In 2019, tax income is estimated to be sufficient to pay 78 percent of HI costs—and by 2082 only 30 percent.
For OASDI, interest income will first be needed to pay a portion of benefits in 2017, although the trust funds will continue to accumulate assets. In 2027, trust fund assets will begin to be depleted and are projected to be exhausted in 2041, after which continuing tax income would be sufficient to cover 78 percent of scheduled benefits. Tax income would cover 75 percent of scheduled benefits in the final year (2082) of the 75-year projection period. Although the projected exhaustion date for the DI Trust Fund is 2025, the value of the OASI Trust Fund would be sufficient at that point to make assets available to pay full DI benefits, but only with authorizing legislation.
The key dates regarding cash flows are shown in the following table.
KEY DATES FOR THE TRUST FUNDS OASI DI OASDI HI
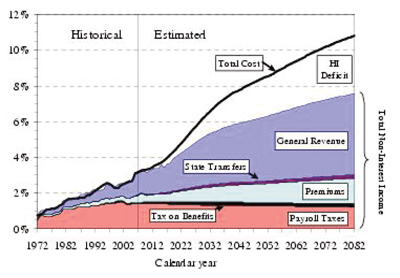
How Do the Sources of Medicare Financing Change? As Medicare costs grow over time, general revenues and beneficiary premiums will play a larger role in financing the program. Chart D shows expenditures and current law non-interest revenue sources for HI and SMI combined as a percentage of GDP. The total expenditure line is the same as displayed in Chart B and shows Medicare cost rising to 10.8 percent of GDP by 2082. Revenue from taxes would remain at roughly 1.5 percent of GDP under current law, while general fund revenue contributions are projected to increase from 1.3 percent in 2008 to 4.5 percent in 2082, and beneficiary premiums from 0.5 to 1.4 percent of GDP. Thus, revenue from taxes would fall substantially as a share of total non-interest Medicare income (from 45 percent to 19 percent) while general fund revenue would rise (from 39 to 60 percent), as would premiums (from 15 percent to 19 percent). These current-law relationships could change as a result of the need to address the future HI Trust Fund deficits. The gap between total non-interest income and expenditures steadily widens due to growing annual HI deficits, which reach 3.4 percent of GDP by 2082. All told, by 2082 the Medicare program is projected to require SMI general revenue transfers equal to 4.5 percent of GDP. Moreover, the HI deficit would equal another 3.6 percent of GDP, and there is no provision to finance this deficit under current law through general fund transfers or any other revenue source.
Chart D—Medicare Cost and Non-Interest Income by Source as a Percent of GDP
The Medicare Modernization Act (2003) requires that the Board of Trustees determine each year whether the annual difference between program outlays and dedicated revenues (the bottom four layers of Chart D) exceeds 45 percent of total Medicare outlays within the first 7 years of the 75-year projection period. In effect, the law sets a threshold condition that signals that a trust fund's dedicated financing is inadequate and/or that general revenue financing of Medicare is becoming excessive. In that case, the Trustees are required to issue a determination of "excess general revenue Medicare financing." When that determination is made in two consecutive reports, a "Medicare funding warning" is triggered. The warning requires the President to respond by submitting proposed legislation within 15 days of the next budget submission to address the problem, and for Congress to consider the proposal on an expedited basis.
This year's report projects the difference between outlays and dedicated financing revenues to exceed 45 percent in 2014, prompting a determination of "excess general revenue Medicare financing" for the third consecutive report. In response to the "Medicare funding warning" issued in the 2007 Medicare Trustees Report, President Bush submitted legislation in February 2008. Because no further action has been taken as of the date of this report, another "Medicare funding warning" is triggered.
Why is Reform to Improve the Social Security and Medicare Financial Imbalances Needed? Concern about the long-range financial outlook for Medicare and Social Security often focuses on the exhaustion dates for the HI and OASDI Trust Funds—the time when projected finances under current law would be insufficient to pay the full amount of scheduled benefits. A more immediate issue is the growing burden that the programs will place on the Federal budget well before the trust funds are exhausted.
The difference between the cost of scheduled benefits and tax income for the HI and OASDI Trust Funds is shown in Chart E, together with the Federal general fund revenues provided under current law for SMI. During 2008-18 for HI, general revenues (the red bars in the chart) must be used to cover the interest earnings and asset redemptions required to offset the shortfall of HI tax revenues. Similarly, general revenues cover these offsets for the OASDI deficits during 2017-40 (blue bars). In addition, general revenues pay for roughly 75 percent of all SMI costs under current law (green bars).
In 2019 and later for HI, and in 2041 and later for OASDI, there is no provision in current law that would enable full payment of benefits, once the trust funds are exhausted. If asset exhaustion actually occurred, benefits could be paid only up to the amount of ongoing dedicated revenues. Further general fund transfers could not be made to finance the deficits.
Chart E—Projected OASDI and HI Tax Income Shortfall plus the 75-Percent General Fund Revenue Contribution to SMI (Percentage of GDP)

The initial negative amounts shown for OASDI indicate that tax income exceeds cost (which occurs during 2008-16) and represent net cash flow to the Treasury that results in the issuance of special Treasury bonds to the trust funds. Those OASDI net revenues are more than offset by the Medicare general revenue requirements under current law. For instance, in 2008 the Social Security tax income surplus ($79 billion) is estimated to be significantly smaller than the statutory Medicare Part B and Part D general revenue transfers, resulting in an overall cash requirement of $117 billion (0.8 percent of GDP) from the general fund of the Treasury.
The combined difference grows each year, so that by 2017, net revenue flows from the general fund will total $449 billion (2.0 percent of GDP). The positive amounts that begin in 2017 for OASDI, and in 2008 for HI, initially represent payments the Treasury must make to the trust funds when assets are redeemed to help pay benefits in years prior to exhaustion of the funds. Note that neither the redemption of trust fund bonds, nor interest paid on those bonds, provides any new net income to the Treasury, which must finance redemptions and interest payments through some combination of increased taxation, reductions in other government spending, or additional borrowing from the public.
Chart E shows that the difference between outgo and dedicated payroll tax and premium income will grow rapidly in the 2010-30 period as the baby-boom generation reaches retirement age. Beyond 2030, the difference continues to increase nearly as rapidly due primarily to health care costs that grow faster than GDP. After the trust fund exhaustion dates (2041 for OASDI, 2019 for HI), the increasing positive amounts for OASDI and HI depict the excess of scheduled benefits over projected program income. When the statutory SMI general fund revenue requirements are added in, the projected combined Social Security and Medicare deficits and statutory general fund revenues in 2082 equal 9.3 percent of GDP, indicating the magnitude of the potential effect on the Federal budget if general revenues were used to ensure payment of all scheduled program benefits. A similar burden today would require more than 80 percent of all Federal income tax revenues, which amounted to 11.2 percent of GDP in 2007.
To put these magnitudes into historical perspective, in 2007 the combined annual cost of HI, SMI, and OASDI amounted to 38 percent of total Federal revenues, or about 7 percent of GDP. That cost (as a percentage of GDP) is projected to double by 2060, and then to increase further to nearly 17 percent of GDP in 2082. It is noteworthy that over the past four decades, the average amount of total Federal revenue as a percentage of GDP has been 18 percent, and has not exceeded 21 percent in a given year. Assuming the continued need to fund a wide range of other government functions, the projected growth in Social Security and Medicare costs would require that the total Federal revenue share of GDP increase to wholly unprecedented levels.
This year's Trustees Reports describe large long-term financial imbalances for Social Security and Medicare, and demonstrate the need for timely and effective action. The sooner that solutions are adopted, the more varied and gradual they can be.
