 |
IN FOCUS |
|
by Matthew W. Daus, Esq. |
||
I recently co-authored a study with experts from the National Institute for Occupational Safety and Health (NIOSH), namely Dr. Cammie K. Chaumont Menéndez and Dr. Christina Socias-Morales. The study is entitled Work Related Violent Deaths in the US Taxi and Limousine Industry 2003 to 2013: Disparities Within a High Risk Working Population. It was published in the Journal of Occupational & Environmental Medicine.
The full study can be accessed via the following link:
work-realated violent death in the taxi and limousine industry1
Historically, occupational public health research has highlighted that taxicab drivers are among one of many at risk work forces. Prior interventions designed to reduce violence in this worker population have been evaluated. However, until now, there has been little academic research detailing the magnitude and distribution of violent work related deaths among workers in the for-hire ground transportation industry.
This study analyzed data from the Bureau of Labor Statistics (BLS) Census of Fatal Occupational Injuries (CFOI) which found 366 cases of taxicab and limousine driver deaths at a rate of 17.8 per 100,000 workers over an eleven year period from 2003 to 2013. This study also analyzed the trend of the fatalities based on demographics, work characteristics, and other injury details.
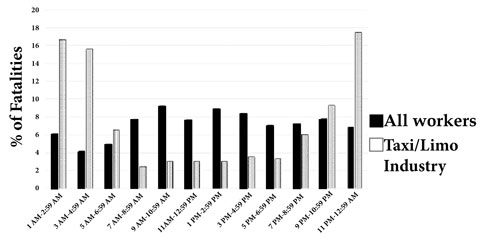
Despite an overall decline in workplace violence since the mid-1990s to early 2000s, violent death rates among taxi and limousine drivers are still higher when compared to other professions. As shown in Figure 1, violent deaths predominantly occurred after 9pm and before 7 am. However, after 7 am and before 9 pm, the distribution of violent deaths among taxi and limousine drivers is less than other workers.
In terms of demographics, US born taxi and limousine drivers experienced higher fatality rates than foreign born drivers (Figure 2). These findings were corroborated by a survey of 130 taxicab drivers in which foreign born drivers reported fewer incidents of physical assault, robbery and/or weapon confrontation than their native born counterparts.2
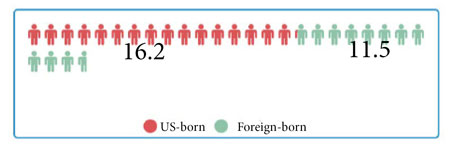
Another study showed that foreign born drivers predominantly employed self-care strategies to manage stress, reduce danger, and maintain power and control in the taxicab.3
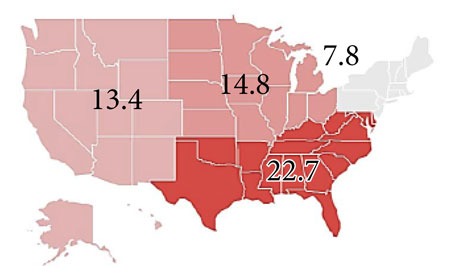
Fatality rates were highest in the South compared to other regions of the U.S. (Figure 3). These observations were not surprising in light of similar findings examining disparities among work related homicides. 5
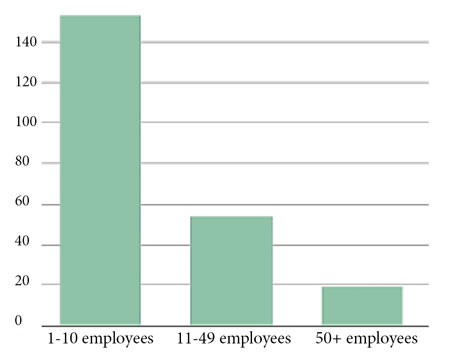
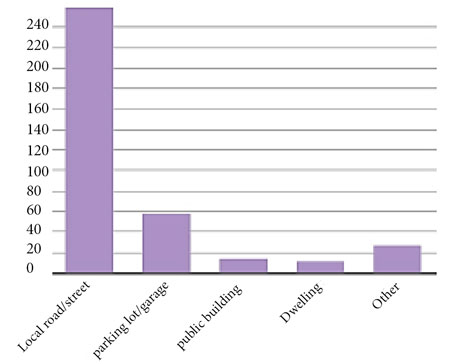
Where reported, a majority of fatalities (42%) occurred in establishments with 10 or fewer employees (Figure 4). The predominant location of the incidents (71%) was a local road or street (Figure 5).
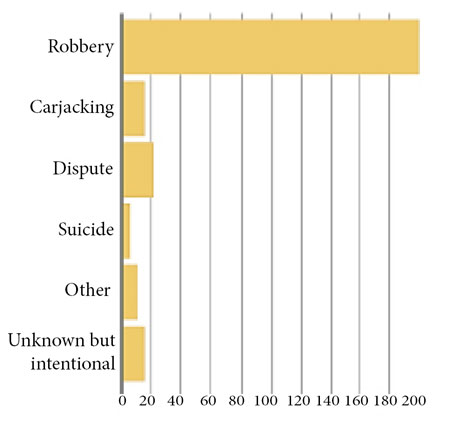
As shown in Figures 6 and 7, the overarching motive was robbery (55%), and the most frequently occurring weapons involved firearms (82%).

The root cause for the persistently high number of violent deaths among taxi and limousine industry workers may be the inadequate and uneven adoption of safety equipment, such as cameras and partitions. Generally, cameras were found to be mandated only by city ordinance in the West and company policy in the South, while partitions were primarily mandated only in the Northeast and Midwest.
Being a city licensed driver offers the best protection against unwarranted incidents. City licensed drivers are protected under a formal structure where safety measures are regulated for the benefit of both the driver and the passenger. Such a system also allows weak safety links in the regulatory framework to be identified and improved. Besides that, training equips drivers with the awareness and knowledge of violence de-escalation and counter measures during robbery.
Studies have shown that 29% of adult consumers in the US do not have a credit card and 32% do not have a smartphone. ⁷ The incumbent taxi and for-hire vehicle industry may become even more of a cash industry increasing its operations in under served and unbanked areas in the future. This is due to the unchecked proliferation of Transportation Network Companies (TNCs), such as Uber and Lyft, which do not accept cash at all and operate mostly in cities.
Studies have shown that industries that handle cash continue to be disproportionately affected with higher risk, 8 and this emerging dynamic could further increase the risk of workplace violence to taxi and for-hire drivers.
A leading example of a jurisdiction that has handled taxi and for-hire driver safety policy implementation is New York City. In the early 2000s, the NYC livery industry experienced a crisis with a cluster of daily homicides and robberies within a period of weeks.9 The NYC Taxi & Limousine Commission (TLC), the NYC Mayor’s Office, the NYC Economic Development Corporation (EDC) and the NYC Police Department (NYPD) worked closely together through a combination of increasing awareness, emergency rulemaking mandating safety equipment. They targeted law enforcement programs and created a fund to subsidize safety partitions or in-vehicle security cameras.10
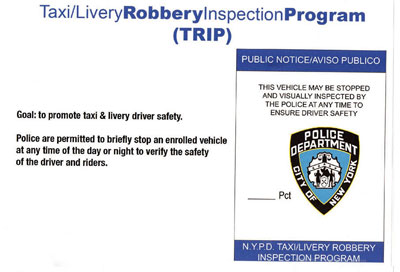
Specific examples of initiatives included the Taxi/Livery Robbery Inspection Program (TRIP),11 where drivers consented to having their vehicles stopped and searched by NYPD, and the $5 million TLC-EDC fund for installing cameras or partitions. 12 The lawless activity ceased eventually, and there have been few, if any murders of taxi and for-hire drivers over the last two decades as a result of these successful policies.
This study shows that there is still much more work to be done in the area of increasing work place safety for taxi and for-hire drivers. Like the successful model in NYC, the best results can be gained if proper resources are devoted and governmental agencies prioritize and coordinate to protect drivers.
The use of smartphone apps and credit cards is a positive development for many drivers given the increased safety involved in knowing who the passenger is. However, certain drivers may migrate to a cash fueled environment, increasing their risk of being robbed. Regulators should be aware of and address this inevitable trend.
Also, some local government officials are looking at ways to level the regulatory playing field between TNCs and the incumbent taxi industry, and are contemplating removing safety partitions and camera requirements to reduce costs for drivers.13 This would be a mistake and could lead to more incidents and fatalities. Now is the time to put the findings of this study to work to make sound and effective policy to protect all drivers everywhere in the U.S and beyond.
...................................................................................................................................................................


