Adam McCann, Financial Writer
Autumn, 2018

Expect the Hispanic and Latino community's contributions to the U.S. economy to be nothing short of monumental in the coming decades. Not only is this demographic expected to make up a more than 25% of the U.S. population by 2050—translating into large buying power—this group is also creating businesses at 15 times the national rate, according to one report.
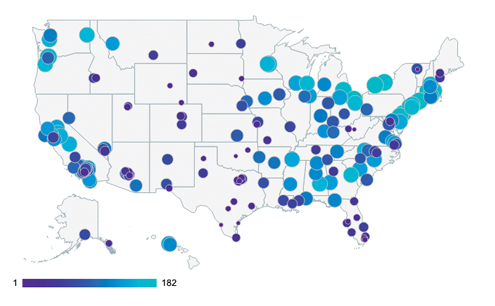
The timing, therefore, could not be more appropriate for Hispanic entrepreneurs to make their business ideas a reality. But what places have the best conditions for a Hispanic owned enterprise? To answer that question, WalletHub compared more than 180 U.S. cities across 23 key indicators of business friendliness toward Hispanic entrepreneurs.
Our data set of 23 key metrics ranges from Hispanic entrepreneurship rate to median annual income of Hispanics to share of Hispanics with at least a bachelor's degree.
Overall Rank (1=Best) |
City |
Total Score |
'Hispanic Business-Friendliness' Rank |
'Hispanic Purchasing Power' Rank |
1 |
Laredo, TX |
61.72 |
1 |
10 |
2 |
South Burlington, VT |
61.10 |
10 |
1 |
3 |
Charleston, WV |
57.40 |
32 |
3 |
4 |
Corpus Christi, TX |
57.29 |
7 |
12 |
5 |
Oklahoma City, OK |
55.56 |
6 |
38 |
6 |
Pembroke Pines, FL |
54.93 |
13 |
16 |
7 |
Amarillo, TX |
54.70 |
9 |
26 |
8 |
San Antonio, TX |
54.59 |
12 |
18 |
9 |
Bismarck, ND |
54.52 |
87 |
2 |
10 |
Casper, WY |
53.92 |
14 |
22 |
11 |
Miami, FL |
53.68 |
2 |
101 |
12 |
Tulsa, OK |
53.59 |
5 |
79 |
13 |
Grand Prairie, TX |
53.10 |
40 |
6 |
14 |
Sioux Falls, SD |
52.98 |
15 |
31 |
15 |
Cheyenne, WY |
52.89 |
8 |
56 |
16 |
Tampa, FL |
52.84 |
3 |
110 |
17 |
Irving, TX |
52.78 |
30 |
11 |
18 |
Fort Worth, TX |
52.53 |
27 |
19 |
19 |
El Paso, TX |
52.25 |
18 |
39 |
20 |
Austin, TX |
52.19 |
33 |
17 |
21 |
Orlando, FL |
52.19 |
11 |
51 |
22 |
Hialeah, FL |
52.01 |
4 |
120 |
23 |
Juneau, AK |
51.91 |
61 |
9 |
24 |
Overland Park, KS |
51.77 |
59 |
7 |
25 |
Plano, TX |
51.71 |
46 |
14 |
26 |
Huntington, WV |
51.65 |
77 |
8 |
27 |
Gilbert, AZ |
51.58 |
106 |
4 |
28 |
West Valley City, UT |
51.54 |
25 |
35 |
29 |
Houston, TX |
51.23 |
19 |
49 |
30 |
Boise, ID |
51.21 |
34 |
21 |
31 |
Dallas, TX |
50.89 |
22 |
48 |
32 |
Denver, CO |
50.64 |
23 |
52 |
33 |
Lewiston, ME |
50.40 |
91 |
5 |
34 |
Scottsdale, AZ |
50.22 |
43 |
30 |
35 |
Rapid City, SD |
50.19 |
35 |
37 |
36 |
Irvine, CA |
50.15 |
56 |
20 |
37 |
Brownsville, TX |
50.13 |
17 |
75 |
38 |
Springfield, MO |
50.00 |
21 |
66 |
39 |
St. Petersburg, FL |
49.84 |
65 |
13 |
40 |
Columbia, MD |
49.70 |
68 |
15 |
41 |
Fort Lauderdale, FL |
49.45 |
16 |
89 |
42 |
Jacksonville, FL |
49.37 |
42 |
43 |
43 |
Salt Lake City, UT |
48.99 |
20 |
88 |
44 |
Cape Coral, FL |
48.62 |
51 |
45 |
45 |
Peoria, AZ |
48.36 |
74 |
24 |
46 |
Arlington, TX |
48.35 |
29 |
81 |
47 |
Henderson, NV |
48.19 |
60 |
36 |
48 |
Chesapeake, VA |
48.16 |
66 |
29 |
49 |
Atlanta, GA |
48.12 |
28 |
87 |
50 |
Aurora, CO |
48.08 |
54 |
46 |
51 |
Portland, ME |
47.77 |
52 |
54 |
52 |
Mesa, AZ |
47.75 |
41 |
72 |
53 |
Lubbock, TX |
47.70 |
53 |
50 |
54 |
Nashville, TN |
47.47 |
73 |
33 |
55 |
Billings, MT |
47.31 |
26 |
105 |
56 |
Raleigh, NC |
47.15 |
100 |
23 |
57 |
Tempe, AZ |
47.12 |
93 |
27 |
58 |
Colorado Springs, CO |
46.91 |
55 |
61 |
59 |
Fargo, ND |
46.66 |
62 |
58 |
60 |
Port St. Lucie, FL |
46.63 |
36 |
97 |
61 |
New Orleans, LA |
46.29 |
38 |
106 |
62 |
Nampa, ID |
46.16 |
85 |
44 |
63 |
Garland, TX |
46.15 |
72 |
55 |
64 |
Chandler, AZ |
46.08 |
95 |
40 |
65 |
Santa Ana, CA |
45.99 |
49 |
95 |
66 |
Durham, NC |
45.79 |
116 |
32 |
67 |
Fremont, CA |
45.76 |
123 |
34 |
68 |
Kansas City, MO |
45.68 |
64 |
73 |
69 |
St. Louis, MO |
45.65 |
48 |
108 |
70 |
Gulfport, MS |
45.56 |
45 |
111 |
71 |
Albuquerque, NM |
45.33 |
57 |
92 |
72 |
Baton Rouge, LA |
45.29 |
39 |
121 |
73 |
Anchorage, AK |
45.09 |
99 |
53 |
74 |
Ontario, CA |
44.91 |
80 |
71 |
75 |
Bakersfield, CA |
44.66 |
63 |
94 |
76 |
Phoenix, AZ |
44.59 |
92 |
63 |
77 |
Virginia Beach, VA |
44.58 |
71 |
85 |
78 |
Lincoln, NE |
44.57 |
89 |
68 |
79 |
Shreveport, LA |
44.44 |
44 |
134 |
80 |
Burlington, VT |
44.16 |
50 |
122 |
81 |
Las Vegas, NV |
44.11 |
70 |
98 |
82 |
Las Cruces, NM |
43.86 |
47 |
137 |
83 |
Columbus, OH |
43.61 |
128 |
57 |
84 |
Charlotte, NC |
43.60 |
103 |
78 |
85 |
Chattanooga, TN |
43.57 |
112 |
74 |
86 |
Fort Wayne, IN |
43.51 |
126 |
64 |
87 |
Cincinnati, OH |
43.49 |
117 |
69 |
88 |
Washington, DC |
43.31 |
151 |
41 |
89 |
Cedar Rapids, IA |
43.24 |
118 |
77 |
90 |
Charleston, SC |
43.18 |
110 |
83 |
91 |
Wichita, KS |
43.01 |
83 |
107 |
92 |
Fontana, CA |
42.94 |
152 |
42 |
93 |
Huntington Beach, CA |
42.94 |
96 |
96 |
94 |
Riverside, CA |
42.91 |
81 |
109 |
95 |
Santa Clarita, CA |
42.78 |
94 |
102 |
96 |
Portland, OR |
42.71 |
82 |
112 |
97 |
Glendale, AZ |
42.66 |
121 |
84 |
98 |
Pittsburgh, PA |
42.66 |
170 |
25 |
99 |
Reno, NV |
42.66 |
107 |
93 |
100 |
Oxnard, CA |
42.47 |
125 |
86 |
101 |
Greensboro, NC |
42.47 |
114 |
90 |
102 |
Lexington-Fayette, KY |
42.41 |
136 |
76 |
103 |
Omaha, NE |
42.40 |
104 |
103 |
104 |
Aurora, IL |
42.32 |
115 |
91 |
105 |
Anaheim, CA |
42.08 |
58 |
146 |
106 |
Fort Smith, AR |
41.99 |
142 |
65 |
107 |
Tucson, AZ |
41.98 |
37 |
160 |
108 |
Little Rock, AR |
41.93 |
122 |
100 |
109 |
Rancho Cucamonga, CA |
41.83 |
144 |
67 |
110 |
San Francisco, CA |
41.80 |
79 |
132 |
111 |
Moreno Valley, CA |
41.59 |
142 |
80 |
112 |
Indianapolis, IN |
41.56 |
130 |
99 |
113 |
North Las Vegas, NV |
41.53 |
163 |
47 |
114 |
Warwick, RI |
41.41 |
175 |
28 |
115 |
Mobile, AL |
41.38 |
84 |
133 |
116 |
Seattle, WA |
41.13 |
155 |
62 |
117 |
Richmond, VA |
40.96 |
124 |
114 |
118 |
Baltimore, MD |
40.94 |
148 |
82 |
119 |
Knoxville, TN |
40.87 |
139 |
104 |
120 |
Tallahassee, FL |
40.77 |
101 |
135 |
121 |
Honolulu, HI |
40.74 |
105 |
130 |
122 |
Grand Rapids, MI |
40.56 |
67 |
150 |
123 |
Birmingham, AL |
40.54 |
75 |
149 |
124 |
Nashua, NH |
40.49 |
157 |
70 |
125 |
Huntsville, AL |
40.36 |
88 |
144 |
126 |
Oceanside, CA |
40.30 |
119 |
129 |
127 |
Des Moines, IA |
40.30 |
167 |
59 |
128 |
San Jose, CA |
40.23 |
131 |
119 |
129 |
Jackson, MS |
40.19 |
24 |
175 |
130 |
Louisville, KY |
40.14 |
129 |
124 |
131 |
Newport News, VA |
39.90 |
113 |
139 |
132 |
Chula Vista, CA |
39.87 |
108 |
143 |
133 |
San Diego, CA |
39.69 |
86 |
155 |
134 |
Santa Rosa, CA |
39.59 |
137 |
128 |
135 |
Missoula, MT |
39.51 |
31 |
172 |
136 |
Norfolk, VA |
39.47 |
120 |
141 |
137 |
Fayetteville, NC |
39.46 |
97 |
148 |
138 |
Chicago, IL |
38.90 |
111 |
153 |
139 |
Columbus, GA |
38.90 |
133 |
140 |
140 |
Toledo, OH |
38.80 |
78 |
163 |
141 |
Columbia, SC |
38.76 |
146 |
127 |
142 |
Los Angeles, CA |
38.74 |
76 |
164 |
143 |
Madison, WI |
38.66 |
90 |
158 |
144 |
Sacramento, CA |
38.57 |
138 |
142 |
145 |
Pearl City, HI |
38.56 |
127 |
147 |
146 |
Memphis, TN |
38.45 |
153 |
118 |
147 |
Dover, DE |
38.17 |
177 |
60 |
148 |
Stockton, CA |
37.76 |
135 |
154 |
149 |
San Bernardino, CA |
37.75 |
149 |
138 |
150 |
Long Beach, CA |
37.63 |
102 |
165 |
151 |
Fresno, CA |
37.43 |
134 |
157 |
152 |
Modesto, CA |
37.39 |
160 |
123 |
153 |
Tacoma, WA |
37.29 |
162 |
125 |
154 |
Minneapolis, MN |
37.19 |
171 |
113 |
155 |
Winston-Salem, NC |
37.14 |
109 |
166 |
156 |
Montgomery, AL |
36.91 |
141 |
156 |
157 |
Yonkers, NY |
36.57 |
150 |
152 |
158 |
Garden Grove, CA |
36.45 |
166 |
136 |
159 |
Salem, OR |
36.39 |
173 |
116 |
160 |
Spokane, WA |
36.28 |
174 |
117 |
161 |
Oakland, CA |
36.21 |
169 |
131 |
162 |
Manchester, NH |
36.07 |
132 |
168 |
163 |
Milwaukee, WI |
35.62 |
165 |
145 |
164 |
Akron, OH |
35.60 |
176 |
126 |
165 |
Augusta, GA |
35.45 |
147 |
159 |
166 |
New York, NY |
35.38 |
69 |
182 |
167 |
Glendale, CA |
35.20 |
164 |
151 |
168 |
Boston, MA |
34.75 |
98 |
179 |
169 |
St. Paul, MN |
34.72 |
154 |
162 |
170 |
Vancouver, WA |
34.64 |
179 |
115 |
171 |
Philadelphia, PA |
33.68 |
161 |
167 |
172 |
Detroit, MI |
32.91 |
158 |
170 |
173 |
Jersey City, NJ |
32.89 |
172 |
161 |
174 |
Rochester, NY |
32.82 |
140 |
176 |
175 |
Worcester, MA |
32.40 |
145 |
177 |
176 |
Newark, NJ |
30.60 |
156 |
181 |
177 |
Buffalo, NY |
30.56 |
168 |
174 |
178 |
Wilmington, DE |
30.25 |
159 |
180 |
179 |
Cleveland, OH |
30.18 |
178 |
169 |
180 |
Bridgeport, CT |
28.61 |
180 |
171 |
181 |
Providence, RI |
27.32 |
182 |
173 |
182 |
New Haven, CT |
27.19 |
181 |
178 |

To expand the discussion about the present and future of Hispanic entrepreneurship in the U.S., we asked a panel of minority business experts to share their thoughts on the following key questions:
 |
Associate Professor of Management in the Argyros School of Business and Economics at Chapman University |
What are the biggest challenges faced by Hispanic entrepreneurs?
The biggest challenges faced by Hispanic entrepreneurs are similar to those faced by all entrepreneurs: intense competition, funding startup costs, and time demands required for startups and ongoing ventures. Some Hispanic entrepreneurs lack both knowledge about startup regulatory procedures and don't personally know anyone to mentor them.
Should government authorities create programs or other incentives to specifically encourage Hispanic entrepreneurs? If so, what types of programs or incentives?
Most economists agree that recessions are ended first by new jobs created by small business startups and are then followed by hiring increases at larger firms. It is in the best interest of the economy that government authorities create programs and other incentives to specifically encourage Hispanic entrepreneurs just as programs/incentives exist to encourage female entrepreneurship.
The best programs would be focused on local area resource consolidation such as SBDCs (Small Business Development Centers) at local community colleges and One Stop Startup Resource centers to assist with regulatory forms. For those who require assistance, bilingual services should be considered.
What tips do you have for Hispanic entrepreneurs interested in starting their own business?
Gain work experience in the industry that you plan to start your own business so that you get a more realistic preview of the industry demands. Seek out mentors who can guide you and who can serve as advisors. Use free resources such as SBA services, SCORE chapter workshops and consulting, and resources in the business schools at local colleges and universities. Join groups such as local chambers of commerce, Hispanic chambers of commerce, and network.
In evaluating the best cities for Hispanic entrepreneurs what are the top 5 indicators?
Many larger cities have Hispanic Chambers of Commerce.
 |
Executive Director of the Latino Donor Collaborative, Inc |
What are the biggest challenges faced by Hispanic entrepreneurs?
Latino owned companies are increasing in number at a rapid rate, the fastest rate of any other demographic in America. However, Latino entrepreneurs face a funding ceiling. The key challenging issue is that national banks provide less loan funding to Latino owned businesses relative to other demographic groups.
Latino owned businesses have the lowest rate of business loans from financial institutions among all other firms. Only 12 percent of Latino businesses can access bank loans compared to 18.4 percent for white, 15.3 percent for Asian, and 14.2 percent for black owned firms. Latino firms also have the lowest number of government backed loans, although Latino business owners say they would like to have them.
Should government authorities create programs or other incentives to specifically encourage Hispanic entrepreneurs? If so, what types of programs or incentives?
Yes, there is a need/opportunity for more financial education initiatives targeting the Latino community. More structured efforts from the banks to attract Latinos as clients and make the community feel more comfortable working with the banking industry is essential.
What tips do you have for Hispanic entrepreneurs interested in starting their own business?
In evaluating the best cities for Hispanic entrepreneurs what are the top 5 indicators?
Calculated by funding friendly index using frequency and funding source counts, the top five funding friendly states for Latino businesses are Florida, California, Nevada, Texas and New York.
The current gap between the powerful and constant growth of Latino businesses in America and the lack of funding available is a tremendous growth opportunity for banks and other funders, for Latino owners, and for the American economic growth overall.
Furthermore, the growth achieved by Latino owned businesses has happened without access to Chambers of Commerce, trade associations, non-profit support, the use of governmental business development established systems, etc.
This opportunity gap should help venture capitalists, banks, and other commercial institutions, and nonprofits to engage deeper with the Latino entrepreneur. It should also help policy makers in all fields to empower Latino entrepreneurs for job creation, economic equality, underserved communities support for anti-poverty programs, and the like.
The lack of such initiatives and programs would result in �money being left on the table.� The importance of the Latino entrepreneur for the growth of this country is pure math.
 |
Paul R. Beswick Professor of Innovation |
What are the biggest challenges faced by Hispanic entrepreneurs?
Money and language. For Hispanic/Latino entrepreneurs with low socioeconomic status, capital for starting and growing ventures is limited, and they may not have access to networks that can channel funds to their ideas.
You probably also know that some business entrepreneurs who refer to themselves as Latino or Chicano or some other label reject the term Hispanic, even though there is a national Hispanic Chamber of Commerce.
Low income is typically associated with low levels of education, compounding the problem of obtaining capital. And discrimination against Hispanics, especially immigrants, is very real in parts of the country.
Many immigrants and residents with limited education, inability to communicate effectively in English restricts access to customers, suppliers, sources of finance, and others. On the other hand, facility with Spanish can be a positive in some markets.
Should government authorities create programs or other incentives to specifically encourage Hispanic entrepreneurs? If so, what types of programs or incentives?
Government programs that provide access to capital and to business training/education can be extremely valuable. The U.S. Small Business Administration and its partner Small Business Development Centers are important services in both categories. Government personnel who are fluent in Spanish are critical. Government agencies can work collaboratively with private sector organizations, such as Hispanic Chambers of Commerce and microlenders, e.g., Accion.
What tips do you have for Hispanic entrepreneurs interested in starting their own business?
In evaluating the best cities for Hispanic entrepreneurs what are the top 5 indicators?


