Adam McCann,
Financial Writer
September 3, 2019
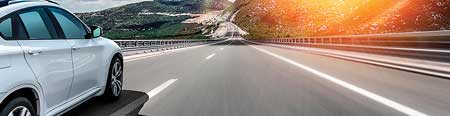
Most Americans rely on cars to get around. According to the Bureau of Transportation Statistics, “87 percent of daily trips take place in personal vehicles.” And even with growing access to public transportation in U.S. cities, most people still choose to travel by car, mainly for reasons such as “comfort and reliability.”
In truth, however, driving is often a major hassle and expense. Drivers annually spend an average of more than 310 hours on the road. That’s nearly 13 days. Add the costs of wasted time and fuel due to traffic congestions, and our collective tab comes to about $124 billion annually, or $1,700 per household.
According to the American Society of Civil Engineers, America’s highways and bridges are underfunded, with an $836 billion backlog of repairs needed. The World Economic forum ranks U.S. roads at 11th in quality out of 140 economically developed nations. It’s clear there’s room for improvement.
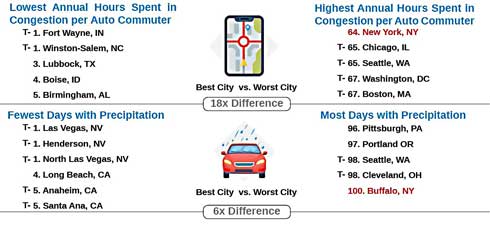
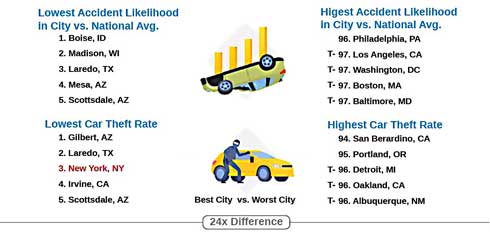
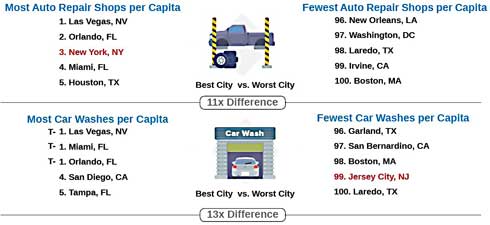
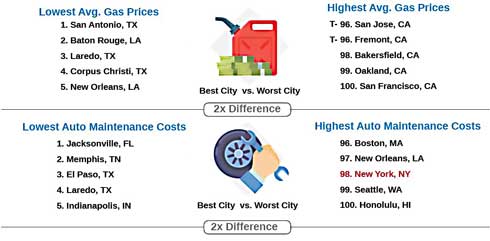
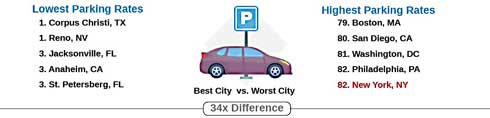
But some cities are better for those behind the wheel. To determine those places, WalletHub compared the 100 largest cities across 30 key indicators of drive friendliness. Our data set ranges from average gas prices to annual hours in traffic congestion per auto commuter to auto repair shops per capita.
| Overall rank (1=Best) | City | Total Score | ’Cost of Ownership & Maintenance’ Rank | ’Traffic & Infrastructure’ Rank | ’Safety’ Rank | ’Access to Vehicles & Maintenance’ Rank |
|---|---|---|---|---|---|---|
| 1 | Raleigh, NC | 69.09 | 1 | 19 | 8 | 62 |
| 2 | Orlando, FL | 66.26 | 7 | 4 | 93 | 4 |
| 3 | Lincoln, NE | 66.21 | 8 | 35 | 4 | 85 |
| 4 | Tampa, FL | 65.38 | 11 | 24 | 70 | 6 |
| 5 | Winston-Salem, NC | 65.02 | 3 | 13 | 32 | 89 |
| 6 | Birmingham, AL | 64.93 | 2 | 1 | 96 | 22 |
| 7 | Corpus Christi, TX | 64.78 | 14 | 7 | 27 | 84 |
| 8 | Boise, ID | 63.78 | 35 | 9 | 13 | 81 |
| 9 | Charlotte, NC | 63.52 | 4 | 64 | 43 | 29 |
| 10 | Greensboro, NC | 63.44 | 6 | 37 | 62 | 66 |
| 11 | El Paso, TX | 63.06 | 18 | 26 | 18 | 51 |
| 12 | Scottsdale, AZ | 63.35 | 51 | 2 | 17 | 54 |
| 13 | Plano, TX | 63.06 | 18 | 26 | 18 | 51 |
| 14 | Jacksonville, FL | 62.97 | 9 | 15 | 81 | 30 |
| 15 | Atlanta, GA | 62.90 | 10 | 23 | 88 | 8 |
| 16 | Austin, TX | 62.08 | 37 | 36 | 35 | 13 |
| 17 | St. Petersberg, FL | 61.66 | 5 | 28 | 80 | 69 |
| 18 | San Antonio, TX | 61.46 | 22 | 45 | 67 | 11 |
| 19 | Durham, NC | 61.33 | 13 | 38 | 28 | 90 |
| 20 | Laredo, TX | 60.95 | 21 | 58 | 7 | 99 |
| 21 | Virginia Beach, VA | 60.73 | 23 | 71 | 15 | 71 |
| 22 | Lexington-Fayette, KY | 60.73 | 12 | 56 | 37 | 86 |
| 23 | Wichita, KS | 60.51 | 34 | 18 | 36 | 87 |
| 24 | Las Vegas, NV | 60.45 | 76 | 6 | 47 | 5 |
| 25 | Arlington, TX | 60.31 | 32 | 52 | 40 | 27 |
| 26 | Gilbert, AZ | 60.25 | 65 | 20 | 3 | 95 |
| 27 | Houston, TX | 60.15 | 31 | 73 | 66 | 2 |
| 28 | Mesa, AZ | 60.15 | 57 | 21 | 14 | 60 |
| 29 | Dallas, TX | 60.09 | 29 | 55 | 72 | 7 |
| 30 | Irving, TX | 60.04 | 26 | 53 | 29 | 65 |
| 31 | Chandler, AZ | 60.03 | 63 | 3 | 19 | 94 |
| 32 | Fort Worth, TX | 59.99 | 42 | 49 | 49 | 19 |
| 33 | Irvine, CA | 59.75 | 79 | 5 | 1 | 32 |
| 34 | Colorado Spring, CO | 59.66 | 24 | 70 | 24 | 64 |
| 35 | Chesapeake, VA | 59.62 | 36 | 68 | 11 | 96 |
| 36 | Omaha, NE | 59.46 | 19 | 61 | 45 | 48 |
| 37 | Oklahoma City, OK | 59.42 | 47 | 50 | 30 | 40 |
| 38 | Lubbock, TX | 59.36 | 33 | 8 | 65 | 83 |
| 39 | Garland, TX | 59.32 | 38 | 47 | 48 | 42 |
| 40 | Nashville, TN | 59.07 | 27 | 30 | 71 | 41 |
| 41 | Fort Wayne, TX | 58.53 | 19 | 51 | 56 | 80 |
| 42 | Norfolk, VA | 58.22 | 17 | 65 | 50 | 88 |
| 43 | Tucson, AZ | 58.11 | 44 | 16 | 79 | 39 |
| 44 | Toledo, AZ | 57.93 | 16 | 34 | 73 | 82 |
| 45 | Henderson, NV | 56.67 | 87 | 10 | 6 | 75 |
| 46 | Louisville, KY | 56.57 | 40 | 60 | 68 | 46 |
| 47 | Columbus, OH | 56.51 | 25 | 69 | 76 | 31 |
| 48 | Reno, NV | 56.38 | 69 | 32 | 23 | 79 |
| 49 | Phoenix, AZ | 56.21 | 55 | 29 | 73 | 24 |
| 50 | Kansas City, MO | 56.06 | 28 | 22 | 91 | 72 |
| 51 | Tulsa, OK | 55.44 | 67 | 39 | 57 | 36 |
| 52 | Buffalo, NY | 55.11 | 49 | 76 | 33 | 76 |
| 53 | Indianapolis, IN | 54.92 | 48 | 63 | 78 | 28 |
| 54 | Madison, WI | 54.86 | 52 | 78 | 10 | 92 |
| 55 | Cincinnatii, OH | 54.51 | 50 | 54 | 89 | 15 |
| 56 | St. Louis, MO | 54.37 | 30 | 66 | 98 | 10 |
| 57 | St .Paul, MN | 53.80 | 59 | 77 | 42 | 67 |
| 58 | Bakersfield, CA | 53.50 | 75 | 14 | 63 | 61 |
| 59 | Auroro, CO | 53.47 | 43 | 88 | 54 | 73 |
| 60 | Chula Vista, CA | 53.46 | 98 | 12 | 2 | 59 |
| 61 | Pittsburgh, PA | 52.92 | 58 | 85 | 46 | 20 |
| 62 | Anaheim, CA | 52.73 | 78 | 57 | 31 | 18 |
| 63 | Miami, FL | 52.68 | 64 | 74 | 95 | 1 |
| 64 | Memphis, TN | 52.68 | 41 | 42 | 97 | 58 |
| 65 | Sacremento, CA | 52.66 | 84 | 41 | 38 | 17 |
| 66 | San Diego, CA | 52.63 | 100 | 25 | 9 | 9 |
| 67 | Anchorage, AK | 52.59 | 45 | 93 | 34 | 100 |
| 68 | Glendale, AZ | 52.49 | 70 | 17 | 75 | 91 |
| 69 | Riverside, CA | 52.41 | 83 | 31 | 21 | 50 |
| 70 | Denver, CO | 52.39 | 53 | 86 | 59 | 33 |
| 71 | Baton Rouge, LA | 52.30 | 60 | 43 | 87 | 49 |
| 72 | Santa Ana, CA | 52.18 | 92 | 46 | 20 | 16 |
| 73 | Minneapolis, MN | 52.16 | 68 | 79 | 39 | 57 |
| 74 | Hialeah, FL | 52.03 | 39 | 81 | 92 | 38 |
| 75 | Fremont, CA | 51.77 | 86 | 59 | 12 | 47 |
| 76 | Albuquerque, NM | 51.59 | 46 | 40 | 99 | 44 |
| 77 | Long Beach, CA | 51.33 | 88 | 62 | 22 | 23 |
| 78 | North Las Vegas, NV | 51.25 | 89 | 11 | 44 | 93 |
| 79 | Portland, OR | 51.05 | 61 | 72 | 83 | 25 |
| 80 | Boston, MA | 49.95 | 54 | 92 | 51 | 78 |
| 81 | Jersey City, NJ | 49.94 | 56 | 98 | 53 | 37 |
| 82 | Fresno, CA | 49.60 | 82 | 27 | 60 | 74 |
| 83 | New Orleans, LA | 49.35 | 77 | 67 | 61 | 77 |
| 84 | Stockton, CA | 48.59 | 80 | 33 | 55 | 98 |
| 85 | Cleveland, OH | 47.68 | 66 | 87 | 90 | 21 |
| 86 | San Jose, CA | 47.54 | 90 | 75 | 25 | 68 |
| 87 | Milwaukee, WI | 47.37 | 72 | 84 | 77 | 52 |
| 88 | Baltimore, MD | 47.17 | 62 | 80 | 94 | 63 |
| 89 | Chicago, IL | 46.05 | 74 | 99 | 52 | 14 |
| 90 | San Bernardino, CA | 45.82 | 99 | 48 | 58 | 97 |
| 91 | Honolulu, HI | 45.38 | 96 | 82 | 26 | 35 |
| 92 | New York, NY | 45.35 | 93 | 100 | 16 | 3 |
| 93 | Los Angeles, CA | 45.22 | 94 | 89 | 41 | 12 |
| 94 | Seattle, WA | 44.04 | 85 | 91 | 64 | 43 |
| 95 | Washington,DC | 43.87 | 71 | 95 | 86 | 55 |
| 96 | Newark, NJ | 43.72 | 73 | 97 | 84 | 26 |
| 97 | San Francisco, CA | 40.24 | 97 | 90 | 69 | 56 |
| 98 | Philadelphia, PA | 40.00 | 91 | 96 | 82 | 34 |
| 99 | Oakland, Ca | 39.73 | 95 | 83 | 85 | 53 |
| 100 | Detroit, MI | 37.40 | 81 | 94 | 100 | 45 |
With cost, safety and environmental impact ranking among the top concerns for the auto industry, we asked a panel of experts to share their thoughts on the following key questions:
 Nicholas E. Lownes
Ph.D., PE – Associate Professor, Associate Head for Undergraduate Education and Outreach, Department of Civil and Environmental Engineering, University of Connecticut
One of the best ways to save money on transportation expenses is to investigate alternate options for travel.
Public transportation in many metro areas is an affordable alternative to driving and has additional benefits to the environment by reducing emissions and fuel consumption caused by traffic congestion.
Owning and operating a personal vehicle costs between $5,000 and $8,000 per year when you consider all of the costs associated with owning, maintaining and fueling the vehicle. Owning fewer vehicles is a great way to save money.
Automobiles began to outnumber horses in the U.S. in the mid- to late-1920’s, about 20 years after the Model T went into production. Automated or self driving vehicles (AVs) present a similar shift in technology that has started just recently.
If we take the starting point of automated vehicle introduction as within the past couple of years, that puts the point at which AVs outnumber human driven sometime between 2035 and 2040. I think this time frame makes sense from the standpoint of the time it will take to refine the technology, ramp up production, increase market penetration and address regulatory challenges associated with AVs.
40,000 people are killed in car accidents every year and AVs stand to nearly eliminate these fatalities if the technology reaches its potential. AVs also open up mobility options for people who are currently unable to drive a personal vehicle due to physical disability which is also a huge benefit.
I think there are some equity issues that need to be considered from a regulatory standpoint to make sure that the advent of AVs does not create another situation where there are mobility “haves” and mobility “have nots” – especially if we are talking about a situation in which a single entity owns and operates a fleet of AV taxis and shuttles.
On balance I think AVs will be a net benefit due to the lives saved and the mobility options created for people.
I think the important focus is evaluating the best cities for mobility, rather than targeting drivers only. The best cities for mobility have a variety of public transportation options available. They have downtowns and infrastructure built with pedestrians, bicycles, buses, trains and private autos in mind.
The best cities for mobility have multi-modal long range plans that directly guide decisions about investing in infrastructure, and they regularly revisit and update these plans.
The best cities also ensure that resources and investments are equitably distributed, providing quality transportation options to all of their residents.
The best means to reduce automobile traffic and congestion is to provide quality options so that people can have their mobility needs met without hopping in the car.
Building more lanes of highway, counterintuitively, often generates more traffic as people relocate to take advantage of lower house prices further out from a city and wind up filling up those extra lanes in a short time!
Improving safety is something that transportation professionals are thinking about constantly, from the federal government to local municipalities. An important consideration at the local level is being intentional about designing roadways that are built for all users – pedestrians, bicyclists and autos.
Certain design features can help make drivers drive more safely subconsciously. In large part, getting drivers to slow down in urban areas to increase reaction time and lower the severity of accidents when they happen.
.................................................................................................................................................................
 Mary Angelica Painter
Ph.D. Candidate, Transportation, Technology, & Research Methodology, University of Missouri-Saint Louis
According to the 2016 U.S. Census, 76% of Americans commute to work alone for all work days, while another 9% carpooled.
Commuters in the United States are highly dependent on cars, but there are many options for commuting – most of them more cost effective.
Drivers can join the other 9% and start carpooling to work. Commuters can find carpooling options through mobile apps such as Carma, iCarpool, or Waze.
If commuters are in an area where light rail or bus service, these are a great way to get around for less money but be sure to check mass transit schedules since public transportation can either take shorter or longer than to commute by car.
If drivers are looking for free, zero emissions options, biking (bikeshare options are available in many large cities) and walking are suitable in many cities.
To understand when driverless cars will hit the road, we first need to understand three aspects at the center of the self driving car debate: driverless technology, government, and the public.
The technology of driverless vehicles seems to be moving quickly. In some cities, including Pittsburgh, PA and cities in Arizona, commuters can already hail robotic vehicles that are being tested across the country by several companies.
This technology relies on advancements in machine learning, which took strides in just 2017 alone by accounting for bicycles, changing lanes, and adapting vehicles to drive more like humans.
If self driving cars in cities will be anything like Uber, Lyft, and other transportation network companies (TNCs), city governments will welcome these new technologies. Wanting to appear innovative and open to technology and business, many mayors across the United States allowed for TNC operation, keeping in line with these narratives.
Local leadership, enticed by concepts of smart cities and business innovation, would be open to driver less cars.
The main hurdle to automated vehicles is public perception. The Pew Research Center conducted a survey in May of 2017 asking U.S. adults how driver less cars made them feel. Fifty-four percent of drivers said that they are somewhat or very worried about the development of self driving cars, while 56% percent would not personally want to ride in one. It doesn’t seem the public is quite ready to give up driving.
Making a prediction that relies on a public opinion shift is hard to make. Public opinion can change at various rates, so it would be difficult to know when the public will be comfortably on board.
Some of the best ways to reduce traffic and improve safety is to well design a city with many different transportation options and discourage vehicle use.
If bikes and buses have their own dedicated lane, it does not interfere with vehicle traffic, reduces the potential for accidents, and allows for buses to move quicker through urban traffic.
Having robust mass transit systems can entice commuters to not drive since commuting would be smoother, cheaper, and timely with light rail or street cars.
Some cities have taken a stick instead of carrot approach to traffic reduction. Stockholm implemented a congestion tax with fluctuating fees. The tax – which increases during periods and in places with the heaviest traffic – is seen widely as a success. Other cities, like London, have looked to implement a similar policy.
![]()


